
50,000,000,000 Downloaded
This afternoon the 50,000,000,000th app was downloaded from the App Store and Apple is celebrating by giving away $10,000 in App Store credit to some lucky person that pushed them across that threshold. This was pretty cool. Not the giveaway part. I mean it’s nice, but after Apple takes their 30% cut, they’re really only giving away $7,000. Also, if I have it figured right, the download rate was about 25% higher than average during the last hour of the contest, which may have been worth as much as $500,000 additional revenue for that hour. Not too shabby. (See The Surprising Numbers Behind Apps)
Anyway, that’s not the cool bit. The bit that I thought was cool was the code driving Apple’s fancy app counter. It turns out that it was driven by actual download numbers provided by Apple and updated every hour. It gave me a chance to see if there was anything to be learned looking at real download data. Were there any patterns? Could we learn anything about the time people are most likely to be using the App Store?
It turns out that the answer is yes. Very clearly in fact. Check out this fancy (not actually fancy) chart I made:
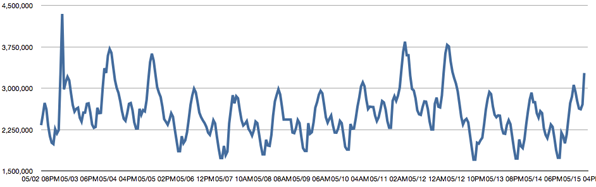 Downloads per hour 5/2/2013 – 5/15/2013
Sorry, it’s a little tiny, but basically, like clockwork, the download rate peaked at 11AM (EDT) each day, including weekends. Except for that bizarre spike at the beginning. Not sure what that was. But otherwise, big spike at 11, then tapering off to a low between 7PM & 8PM followed by a mini-spike at 10PM before drifting down to the nadir at around 3AM each day.
This is perhaps a little easier to see if we look at the average number of downloads by hour. Look another graph!
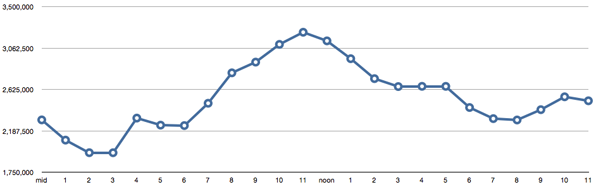 Average downloads by time of day
This might come in handy if, for example, you’re looking to make sure you time your app’s release for maximum exposure. You probably want to make sure your app is ready to go ahead of the crowd which begins building at around 7AM EDT.
I was hoping I could continue to monitor the download rate after the contest ended and see if any longer term patterns materialized, but sadly, Apple seems to have shut it down. Ah well, it was fun while it lasted. While I wouldn’t count on it, maybe they’ll fire it back up again at some point. In the meantime, if you’re interested, you can grab the spreadsheet containing everything I collected during the contest. Please note that this is a Numbers spreadsheet. Also note that I missed a few hours here and there and Apple didn’t seem to update their stats at 6AM GMT for some reason. I interpolated and highlighted those cells in red for those cases.